Atlantic Ocean Volcanism,
OIBs, Tholeiites and Basanites
(Ocean Island Basalts)
(1) Iceland
This is now to be found under "Volcanic Iceland"
(2) British Tertiary Province.
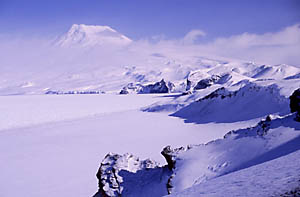
(3) Jan Mayen
Island 400 mi NE of Iceland, the principle volcano being Beerenberg. Maaloe (1986) has shown the rocks are alkali basalt to ankaramite, similar to the Crozet Is lying south-east of South Africa.
| Beerenberg, Jan Mayen. The main cone of about 7000ft appears extinct except for fumaroles and is deeply ice-eroded. There has been some activity (1979-85) on the far side, northern coast.
Photo: Michael Caplain
|
 |
 |
Variation diagram for Jan Mayen & Beerenberg. Note that while for much of the range K is about 80% of Na, in the trachytes they are equal. While well known for the presence of ankaramites (Maaloe et al, 1986) the distribution of rock type is wide. From a rather minimal number of data the Zr/Nb = ~3 (Troenes, et al, 1999). |
|
|
Jan Mayen Ankaramites-alk.bas.
(with two Ti, P, Sr depleted trachytes) |
(Photo by Simun Dalsenni Ohlsen)
|
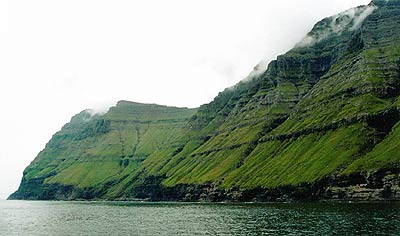
(4) Faeroe Islands
These are built up entirely of Early Tertiary flat-lying basalt flows,
dykes and tephra now deeply eroded by glacial fiords. They are compositionally
very similar to the Tertiary basalts of East and West Iceland, ranging
from depleted magnesian basalts of >11% MgO to ferro-basalts of
>18% Fe, (Rasmussen & Nygaard, 1969). No rocks appear to have
gone beyond the Ti-Mt point and there are no icelandites or rhyolites.
Gariepy, (1983) has carried out trace element analyses which show
the Faeroes to have similar Ce/La, La/Sm, Zr/Nb etc to Iceland.
 |
Tertiary basalts of the Faroes.
Note similarity to Iceland.
|
More recently, (June, 2005) GEOROC
has recorded more data in several minor publications. REE can now
be seen to lie in the 5 - 21 ppm range for La with a La/Sm of 0.7
- 2.5 while Zr/Nb ranges from ~ 30 to 10, ie NMORBS to moderate EMORBs
are present. SiO2/K2O shows rather low silica at 47 - 49% with some
Icelandites of 54%.
The Zr group shows Sr>Zr>Ba>Y>Nb>Rb so the ORB origin
of these rocks cannot be questioned and they should not be associated
with the so-called North-Atlantic Province and the British Tertiary
CFB's.
|__| Variation Diagram for the Faeroe Lavas.
(5) Vesteris Seamount
While not an island this seamount lying east of Greenland has some affinity with Jan Mayen.
 |
Vesteris Seamount, Greenland basin
|
(6) Bermuda
Bermuda is a low-lying island in the western Atlantic formed of uplifted coral lying on a truncated cone of volcanic origin about 8000ft in height, which rests on the Bermuda Rise. In about 1970 Dr "Fab" Aumento of Dalhousie asked me to join a project drilling through the limestone cap of Bermuda. Analogy with the atolls of the Pacific suggested that the coralline rock probably concealed a volcanic base, but really very little was known of the structure of atolls at that time. The site selected was near the main airport where magnetic survey suggested the coral was thin. An 800m drill core penetrated the thin limestone and below was found a series of albitised and chloritised basalts of OIB type into which were injected sheeted dikes or cone sheets of a very titaniferous alkaline rock with titanaugite, titanomagnetite, feldspar and zeolites. The silica was very low (30-40%, the Ti very high (4-6.2% aas was the Sr 550-1050 ppm). In general the composition was rather variable. On an alkali-silica diagram they plotted on the low silica side of basanites, in fact there seemed to be no other rocks quite like them, so we suggested the name "Bermudites".
Our deep drill hole was just north of the Airport
|
The editor of the journal we submitted a paper to objected about yet another name. We sent copies of great database searches showing the lack of equivalents. He was unconvinced. Then one of my students happened to find a mention of the fact that the well-known geochemist of the USGS, Pirsson of C.I.P.W fame had once analysed some chips from a percussion drill hole on Bermuda put down to find water. He also decided there were no rocks quite like them and named them, (guess what?) "Bermudites".
Our editor still refused to budge for, as we pointed out, these were amongst the most alkaline rocks known. He kept repeating, "But suppose your data is wrong?". We had already probed every mineral and some isotope work and were beginning to get tied up with the Leg-37 "Deep Drill" work and the Bermuda project died. So the world still knew nothing about Bermudites 30 years later.
The diagram below shows only a few elements but the unusually high TiO2, about x6 EMORB which means over 6%, can be seen. Total iron exceeds 16%.
 |
Variation diagram for Bermuda, mainly the assumed rejuvenation stage, post shield rocks. Note the high soda of the melanephelinites, with unusually high TiO2 (>6%) and P (to 2%). Zr/Nb is as low as 2 and La/Sm to 7.8.
Five shield stage samples are present of low Ti, Na, P, with Zr/Nb approx 10 and La Sm of 2-2.4 |
 |
Bermudites. (Or melilite mela-nephelinites).
A few Th-Pb determinations of low precision are included. This based on our 1972 data when neither U de M nor Dalhousie had any facility for doing REE. See below for a copy of the rejected paper. |
BUT! The story did not end there.
The other day I (2003) was idly keying in some nephelinite data from the Nunatak region of East Greenland by Bernstein et al(2000, Lithos 53, 1-20) when something caught my eye. After all, not many rocks have 4 - 8.5% TiO2 with Ti in some cases >Al2O3 and in some samples < 35% SiO2. Our Bermudites had surfaced again! About 30 plots showed a complete overlap in all cases, though some of the Greenland rocks are even higher in Mg, Cr, Ni, Fe and Ti. Are the heavy REE also very high or do Yb,Lu suddenly drop? Bernstein offered to get some ICPMS work done on our original Bermuda core which was stored at Dalhousie University at Halifax. They kindly gave us about 35 samples of the orginal drill cores and a Faroese student Simun Dalsenni Olsen carried out ICPMS work in Copenhagen, Denmark, for an MS degree.
This showed that our contention of 1974 was correct, these are some of the most alkaline rocks known. Simun also analysed 320 of the clinopyroxene phenocrysts which has shown them to be also extreme with up to about 9% TiO2, Al2O3 etc Later Peate etal, 2003, (J.Pet. 44, 279-304) found similar rocks in the Prince of Wales Bjerge, also in East Greenland which also overlap compositionally with the Bermudites.
A Zr/Nb,Y diagram shows the Bermudites to the most enriched basaltic rock with 225 ppm Nb at 500 ppm Zr and 30 ppm Y. This compares with 20 ppm Nb in NMOBS and 200 ppm Y. This Nb content exceeds that of the Greenland rocks and even the Namaqualand- Bushmanl45fgbfand melilite basalts
 |
Melilite mela-nephelinites from Greenland, similar to the Bermudites. |
- click to enlarge
|
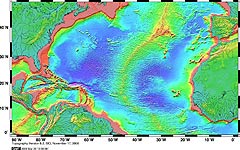
The Bermuda Saga continues! (April, 2004). From the latest bathymetry we can see that Bermuda rises 9 - 10,000ft or more from the seabed – a truly massive cone. The summit Caldera is oval and possibly reduced by marine erosion during the Wisconsin period and is as much as 20 miles across. Our current interpretation is that Bermuda is a series of elevated atolls (the only ones to occur in the Atlantic) lying in a chain orientated along the southeastern caldera ring fracture. Six more drill holes have shown volcanic rock around the periphery of St Georges Bay, Harrington Sound, Great Sound etc. As the latter almost forms a complete ring it may be the youngest of the coalescing atolls lying on the rims of a parasitic cone. However it is possible they could be erosional.
The results of the ODP sites 418a, 417d drill cores of the Bermuda Basin show the sea-floor in this region to be NMorb. The flows below Bermuda Island though spilitised, are a rather enriched E-type or possibly an Intraplate, Hawaiian type basalt rather less enriched than Mauna Loa. The rejuvenation stage dikes (Bermudites) are highly enriched (> 100x Etype), more so than is seen in Rejuvenation stage basanite-phonolite of say, Maui.
A graduate student of Dalhousie (John Peckenham, thesis) later analysed ME from a dozen samples ontained from a 1974 drill hole near Harrington Sound. Though identified as a mixture of pillow lavas and dykes, all are of Bermudite type and overlap with our earlier data.
Data will eventually (if not rejected again) be eventually published..
 |
The REE of the seafloor near Bermuda from Legs 417D and 418a of the ODP. These are moderately depleted NMORBs. Other material recovered from Leg-43 include EMORB.
|
 |
Normalised REE diagram for:
- summit of the main shield cone, (the two green samples of lowest La) These are higher in HFSE than typical EMORB and fairly close to the Mauna Loa shield stage though no picrites have as yet been found.
- the more enriched members are the mela-nephelinite Bermudite dikes which are evidently Post-Shield.
Simun Dalsenni Olsen produced these data in Denmark under guidance of Dr Bernstein and has approved a pre-publication release of the data, for which our thanks.
The post-shield REE show a wider spread ( a factor of three) than the limited clinopyroxene fractionation effects should cause.
It seems that the REE (plus Th,U) vary with an increase in La/Sm and general alkalinity of the parental magmas, on which is superposed the decoupled effects of the variation in clinopyroxene content, the phenocrysts of which may vary from 1 - 2cm in size.
|
 |
Bermudite Drill Core - EMORB diagram. (2005 data). These appear to be similar to nephelinites from Oahu, or from the Austral Islands, but with higher Fe, T, and lower Al2O3 especially. |
 |
Olivine melilite melanephelinites from Bushmanland and Namaqualand in South-West Africa. The melanephelinites of the East Greenland nunataks (Bernstein etal, 2000,(Lithos 53, 531) and from the Prince of Wales Bjerge ( Peate, etal, J.Pet.44,279-304) overlap with the Bermudites, though some samples have even higher TiO2 and lower Al2O3. The extreme in these representatives of the most alkaline OIBs known, are these from South Africa where TiO2 = Al2O3. No REE available |
|
|
Click here for copy of the unpublished 1974 paper (Geology of Bermuda) which give the basics facts of the Bermudites and spilitised lavas based on our 800m drill core. Unfortunately diagrams, photos of core etc have been lost. |
 (7) Azores (7) Azores
A group of islands close to the Mid-Atlantic ridge opposite Lisbon, Portugal. Flores Id. is to the west of the ridge, Faial, Pico, Sao Jorge, Terceira, Sao Miguel, Santa Maria to the east. Sta Maria is deeply eroded, the rest have quite fresh craters and calderas while a small centre of the coast of Faial (Capelinhos) erupted in 196?). Pico is a conical peak of about 6,000ft, while on Terceira explosive trachytes have left three large calderas and thick ignimbrite sheets.
Sao Jorge (Gunn & Fernandez, unpublished data) is formed of alkali basalts with minor hawaiite. Our data for Flores, Sta Maria, Pico etc (Gunn, unpublished) and for Terceira (Self and Gunn, 1976, C.M.P, 54) includes trace elements, but no REE. White, Tapia and Schilling have produced REE data as well for a mixed series of Azores rocks.
|
|
Variation diagram for the Azores Islands. These rocks include not only the highly explosive ignimbritic commendites of Terceira (Self & Gunn, 1976) but also low alumina pantellerites from the same island. |
|
|
Azores Is, (incl.Trachytes) |
 |
Variation Diagram for the Sete Cidades caldera on Sao Miguel, Azores. This recent work includes good ICPMS data, probably the best for the Atlantic OIB islands.
A sudden decline in Sr on a Zr diagram at about 300 ppm Zr suggests that plagioclase does not in fact appear until about 3% MgO. This also seen on other islands including Ascension, the Cape Verdes and Heard, although not so distinctly. |
 |
A Zr/Nb,Y diagram for Sete Cidades. When we recall that the average Oceanic Basalt has Nb at about half the Y values, we see the large difference in composition. The low Zr/Nb index shows a moderately alkaline series, (Transitional Basalts have Zr/Nb of 10, nephelinites may be <3) |
 (8) Madeira (8) Madeira
Lies some 750mi west of Casablanca, North Africa. Mainly alkali basalt-mugearite. Most recent data is by Schminke and Weibel (1972) who presented major element data. More recently Geldmacher and co-workers have begun a major project on Madeira which is still in process (Geldmacher, J. et al, 2000, E.P.S.L. 183)
|
|
|
Fingerprint diagram for Madeira. This GEOROC composite file which includes the data of Geldmacher etal is known to include some data errors which explains some of the wild points. This will be replaced as soon as possible.
The basic rocks are rather variable ranging from alkali basalt to basanite, but they then trend directly towards trachyte and commendite. |
 |
Variation diagram for Madeira.
Note the distinctive alkali-basalt - hawaiite - mugearite - benmoreiite - trachyte trends. Alumina especially is quite different to calc alkaline or tholeiitic rock series, being slightly concave upwards, but declining suddenly in trachytes towards low alumina pantellerite.
Note also the consistently high TiO2. FeOT and TiO2 do not peak as in tholeiites, but begin to decline after about 5.5 - 6% MgO. |
 |
Madeira, MgO vs Cr, Ni, Co, Zn and Cu |
(9) Canary Is
A group of volcanic islands 60-300 mi off the coast of Africa. The Spanish especially have done a great deal of work here, and there are no less than 38 data files. Only that of Hoernle & Schminke (1993) includes Tr. El + REE. The main islands are Lanzarote, Gran Canaria, Tenerife, Gomera, La Palma and Hierro. There has been quite recent activity in the Las Canadas caldera on Tenerife. The rocks are very sodic alkali basalts-basanites to trachyte-phonolite but tholeiites are also found early in the sequence on Gran Canaria. Tenerife, La Palma and Lanzarote are the most active with 16 eruptions since the 15th Century.The most recent eruption was that of Teneguia (La Palma, 1971)
 |
Variation diagram for the Canary Id Group.
The Canaries are not only the most intensively studied OIB group after Hawaii (GEOROC lists about 120 references with data) but is the most lithologically varied. Rocks range from numerous lherzolites, harzburgites and dunites, through ankaramites, tholeiitic basalts, AOB's and basanites with a few high CaO nephelinites and melilotites, to low silica rhyolite, commendite, trachyte, to low alumina pantellerite. As on Terceira, explosive ignimbrites are present. The Zr/Nb mainly lies between 10 - 3 but a few are more extreme. The average total REE is 316 ppm for all samples but the range is extremely wide from vanishingly small in the dunites to almost 1000 ppm.
The Na/K ratio is 2 or slightly less. Question: which OIB has the highest Na/K ratio? Gough is the most potassic (Na/K = ~0.9) with a narrow lead over Heard, Jan Mayen and Tristan with the Society Is and Kerguelen not far behind. Tubuai and Mangaia are the most sodic known to date, with an average Na/K of 3.3, (excepting of course, the "calc-alkaline" Deception Id. in the Scotia Arc). For comparison, Deception ranges from an Na/K of 8 in basic rocks to 3.6 in the rhyolites. |
 |
REE diagram of the more alkaline of the Canary Id lavas. The ones of highest REE content are the Carbonatites with a surprisingly regular dispersion.
Tephri-phonolites and phonolites have a strongly curved dispersion, being low in the intermediate members. In the more enriched examples as usual a strong negative Eu anomaly occurs.
A band of enriched rocks with a straight line dispersion is also seen. These APPEAR to be the trachytes, benmoreiites, mugearites but a good deal of work needs to be done to confirm this, especially as, as is so often the vase, the rock-naming is non-existent or erroneous in too many cases. eg a rock with 50% silica and 6% total alkalies is NOT likely to be a syenite or trachyte.
Comments from those in the know are most welcome. Are real trachytes-commendites just as enriched in light REE as phonolites? |
 |
ORB normalised diagram for the Canary Islands. It is rather ragged due to many partial analyses, some REE have been filled in by interpolation.
Carbonatites appear especially ragged due to high REE content and vanishingly small amounts of many elements, eg Ti, K and the fact that many of these minor elements have not been analysed. However, the diagram does give a general impression. These, as in the REE diagram, are for rocks with >~6% total alkalies.
Diagrams for the more basic rocks may shown in due course. |
 |
Gran Canaria, (note negative K). |
|
|
Ternary diagrams of Cape Verde showing usual scatter due to inclusion of series of considerable age difference and no really close relationship.
|
|
Canary Is as above
|
 |
Seven files of data from Teneriffe, mainly from the Las Canada Caldera, Canary Is.
This is close to the average OIB compsition. |
(10) Cape Verde Is
A group similar to the Canary Is, 750 mi further south off Senegal.
The main islands are: San Antao, San Vicente, Sal, Boa Vista, San Tiago, Maio, Fogo and Brava. My associate Norman Watkins collected extensively as part of a terrestrial magnetism study, (Gunn & Watkins 1976, BGSA, 87, 1089-). The rocks are again mafic ankaramites, alkali basalts, basanites, tephrites and phonolites. The whole association is extremely sodic, with aegirine phonolites with up to 9.8% Na, 6.5% K2O, 178ppm Rb, 2600ppm Sr, 1400ppm Ba. The potassic Tristan da Cunha and Gough Islands have more Rb (355ppm) approx the same K and 2-3% less soda but are not so highly evolved. More recent work has included REE.
 |
Variation diagrams for the Cape Verde Is, GEOROC compilation.
A series dominated by ankaramites - limburgites grading through to syenites and phonolites of VERY high soda. Since Watkins and I did our study in 1976, a number of new rocks types have been found including nephelinites (with high CaO and carbonatites with CaO so high as to be off the graph). Some lherzolites are also present. |
|
|
Cape Verde Is. |
The latest eruption in the Cape Verdes was that of Fogo which erupted in 1995 -
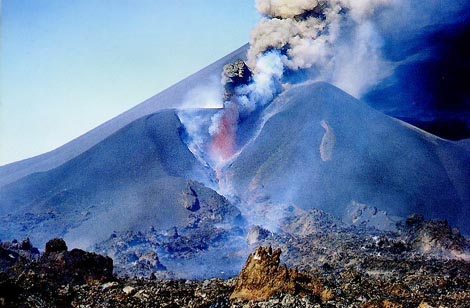
Fogo, 1995, Cape Verde Islands
|
(11) St Pauls Rocks
A group of fault slices of peridotite.
(12) Fernando Noronha
An island 150 mi NE of Brazil. Similar in general to the Cape Verde Is. with ankaramite-basanite-phonolite. (Gunn & Watkins, 1976).
(13) Sao Tome, Principe, Anobon, Fernando Poo
A group of islands in the Gulf of Guinea near the African coast, apparently lying along a fracture, the Cameroon Line. This terminates inland at Mt Cameroon.
 |
Cameroon Line.
|
(14) Ascension Id
Ascension lies directly on the MAR between Recife, Brazil and Angola. It is a dry scoriaceous island with many cones and recent lava flows. Harris (1983) has produced data with REE + Y and with major elements plus Nb, Zr, Y, Rb, Sr but not on same samples.
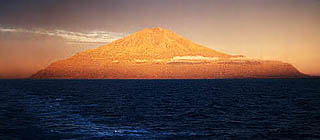
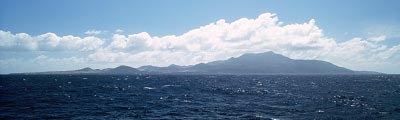 Ascension Island, as she appears from the sea.
|
The more recent data of Kar et al (1998) shows the silicic rocks to be quartz trachytes or commendites, not rhyolites. Note the high K in the more basic rocks declining beyond the sandine "In" point.
 |
Ascension Id. For a recently active island with apparently a single lineage from alkali basalt to quartz trachyte, the data shows considerable scatter, possibly due to there being more than 30 contributors! With a Zr/Nb of ~6 Ascension is only slightly more alkaline that the Westmanneyjar, (Zr/Nb = 8.8) but not nearly so consistent. One is inclined to doubt the sampling in some cases. |
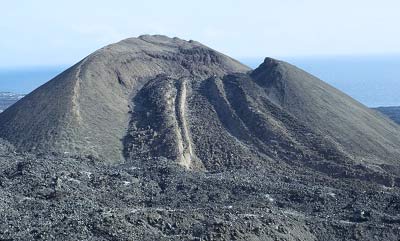 A benmoreite flow issues from a small cone (called "Broken Tooth"), on Ascension Id. Note the prominent levees on either side. An Hawaiite flow crosses from left to right.
(Photo: Barry Weaver)
|
 |
Ascension Id quartz Trachytes association. |
|
|
Basalts of Ascension Id. |
(15) St Helena
This long extinct volcano lies 500 miles east of the MAR at 15ºS consists of an alkali basalt-trachyte association. (Baker, 1969).
 |
St Helena.
Note that as opposed to Tristan and Gough below where Na/K =~ 1, St Helena has on average a Na/K of about 2. When we can understand why Na and K can vary so erratically in all rocks, we will be a lot wiser! |
|
|
(Chaffey et al,1989) Unlike Ascension which lies a few hundred miles to the North-west, St Helena (apart from it's association with the Corsican fellow) seems a pleasant enough island. Note the marked negative K anomaly.
The rocks border between alkali basalt and basanite and between trachyte and phonolite.
Zr reaches almost 1500 ppm and in the more basic rocks Zr/Nb is a low figure of 2.8 but at 750ppm Zr, the Nb suddenly flattens and diminishes.
Obviously a Nb-accepting mineral has appeared, but what? |
 St Helena
|
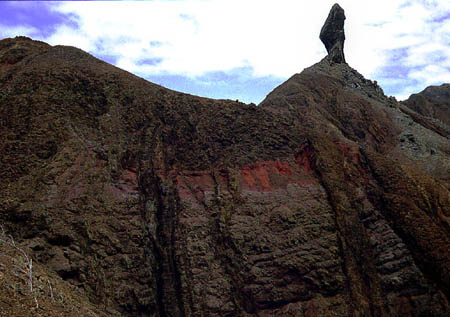
Lot's Wife - layered flows, South Coast, St Helena
|
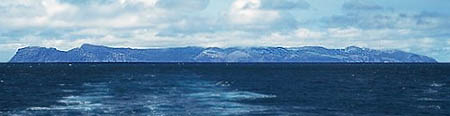
(16) Trinidade
Island 500mi NE of Rio de Janeiro.
 |
Trinidad and Martin Vaz. |
(17) The Tristan da Cunha - Gough Id Group
The two islands groups, (Tristan includes two somewhat smaller islands, Nightingale and Inaccessable about 20 miles off) and possibly including (from rather poor data) the Walvis Ridge have long been known to be more potassic than the other islands of the Atlantic. Sun & McDonough (1989) summarised this and compared the two islands with the more sodic St Helena.
 |
Variation diagram for Tristan da Cunha group. Note the unusual pattern with K and soda in almost equal amounts, the absence of phonolites but common potassic trachytes, the split in the mafic members into high and low Fe, both Ti and P declining after about 4.5% MgO.
Data from GEOROC compilation. Many samples given no location.
|
 |
New data for a trachybasalt, two potassic tephrites and two potassic tephri-phonolites from Tristan by Ewart et al, 2004, J.Pet. 45 (1), 59 - 1-5.
This is the best data on potassic OIB's as yet. Note the P seems to be more fractionated than the TiO2. Also note this diagram is normalised to NMORB, not EMORB.
Data care of Alan Greig; AcquireLab |
 |
Gough Id. Like Tristan, Gough shows approx equal amounts of soda and K in potassic trachytes. |
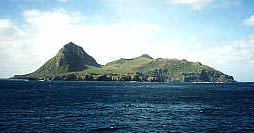
Tristan da Cunha Id. Photo: John Ekwall
|
Gough-Tristan have been postulated to have been derived from enriched mantle (EM) and St Helena from a more depleted mantle with high Pb/Nb (HIMU mantle). I do not believe the fingerprints shown of a single sample from each are entirely valid as except for a possibly accidental -ve K in the St Helena sample and elevated Rb,Ba in the Gough sample they are similar. The same potassic trend seen in Gough Island is also seen in Jan Mayen (Beerenberg volcano) (Maaloe, 1986), and in the Heard Island-Kerguelen Group in the southern Indian Ocean, (Stephenson 1958; Barling et al 1994; Weiss & Frey 1998, 1999)
There is good data from St Helena, (Chaffey et al, 1989) but this island is not particularly sodic being less so than the Tubuai nephelinites in the Austral Is of the Pacific, and even the Westmanneyjar Is off Iceland. The data from Tristan, (le Roex, 1995), and that from Gough (le Roex (1985)) is XRF-only, and is not as extensive as we might like. Weaver, (1987) analysed 3-4 samples from each island but these do not give good trends nor do they agree very well with the other data.
Bouvet which lies further south is something of a mystery, but partial data by Imsland (1977) and le Roex (1982) plus that of Weaver (1987) suggest a alkali basalt - hawaiite island of ordinary OIB type and not as potassic as Tristan which is less so than Gough.
Gough consists of alkali basalt-hawaiite-mugearite to alkaline trachyte, Tristan of basanite-tephrite with St Helena between but including phonolites.
Nightingale Id. Photo: John Ekwall
|
Any K/Na or Na/Rb or Nb/Rb plots shows a good separation between St Helena and Gough, the potassic benmoreiites of Gough merging into more sodic trachytes in the late stages while the St Helena sodic trend become more sodic in the phonolites, each following the low temperature minima. Gough and Tristan also have quite different Mg/Cr, Mg/Ni and Mg/Co relationships. Either Anton and Tony Erlank did not have their XRF Ni techniques sorted out in 1985 or the Cpx-Ol ratio is different. Probably the latter as the crowd at Rondebosch were very devoted spectroscopists.
Dietrich et al (1974) working on drill cores from DSDP Leg 73 found Sites 518A, 519A, 520 and 522B located across the ridge at ~ 30S were all NMORB.s, but at Site 524 near the Walvis Ridge, found alkalibasalt flows and a sill, resting on tholeiitic rocks with a time interval of 9myr. between. The upper rocks have K in excess of Na and are indeed similar to the Gough-Tristan rocks, though the data is only partial.
 |
Ternary diagram for Westmanneyjar, St Helena and Gough Islands showing K-Na trends. |
Gough rocks have very high Zr, up to 1600ppm with Nb to 400 ppm in trachytes but elements other than K,Rb -Na do not show the extreme separation seen in different islands in the Pacific. The Zr/Nb is 3.8 for Tristan, 4 for St Helena and 5.6 for Gough which is a minimal difference. That is, Nb is higher in the more alkaline rocks regardless of the Na/K ratio, as is also seen in Pacific islands. This is confirmed by comparing with the very sodic but only mildly alkaline Westmanneyjar Islands (Furman et al, 1993) which have very low Nb and a Zr/Nb of 8.8 which can be compared to Tubuai or Mangaia in the Austral Is. (Caroff et al,1997) which has a similar Na/K ratio but a Zr/Nb of about 2.
 |
Zr/Nb diagam for St Helena, Tristan da Cunha and Gough Ids. |
 |
Tristan da Cunha
Note lack of negative K anomaly found in sodic alkali basalts.
Obviously a fairly closely related series. |
 |
Inaccessible Id.
This is of alkali-basalt-hawaiite and less alkaline than the basanite tephrite main Tristan island. Nb and Zr are lower relative to silica or to MgO, but the Zr/Nb ratio remains the same, (Cliff, R.et al, 1991). In the same way, though alkalies are lower the Na/K ratio remains the same . With no good REE for Tristan, other comparisons cannot be made |
 |
Gough Id.
Gough has some very interesting trends in the higher differentiates. At about 1% MgO, = FM 85, K suddenly ceases to increase and begins to decline as the rocks become more sodic following the low temperature trough in the qz-ne-leu system. This must coincide with the incoming of a potassic alkali feldspar. Ba collapses, while Zr, Nb and oddly, Zn, go up steeply. Gough would be well worth a new detailed study. |
 |
Bouvet.
Looks totally boring! The Discovery submarine table mount which is off towards South Africa is not well defined. From a grand total of two very old analyses the rock appears OIB-type alkaline. |
Copyright © 1998-2006 Dr B.M.Gunn
BACK
|