|
THE OCEANIC RIDGE BASALTS
The floors of the major ocean basins of the world including the North and South Atlantic, the North and South Pacific, and the Indian Oceans as well as the Red Sea, the Labrador Sea and Baffin Bay are almost entirely composed of a 7-10 km-thick layer of tholeiitic basalt overlain by a thin wedge of marine sediment which is nowhere more than Jurassic in age. As is now well known these basalts are created along the mid-ocean spreading centres by the partial melting of upwelling, circulating Mantle and are spread outwards becoming older towards the continental masses. These oceanic basalts are of unique composition with a completely different fingerprint and chemical characteristics to any basalts which may occur in the continental environment. As they total some 60% of all crustal rocks, their nature and variation is of extreme importance. Knowledge of their composition has only be gained within the last 50 years and an understanding of the rules which govern such variation is less than five years old.
Resting on the off-ridge seafloors are innumerable sea-mounts and islands often of more alkaline composition than the NMORBs but sharing the same fingerprint as seen in the underlying rocks. These may be EMORBS which have a silica content of 47-49% but may pass into alkali-olivine basalts with about 45% SiO2. and are discussed in the chapter on "Oceanic Island Basalts".
All published sea-floor and oceanic ridge geochemical data amounting to some 25,000 partial and full analyses and the associated references are available now from the PETDB Database operated by Columbia University. Virtually all oceanic basalts have undergone at least some fractional crystallisation and the primary unmodified partial melts of the upper mantle, usually termed the "parental magmas" are quite rare.
As it is simply not possible to understand the distribution of elements within the Oceanic basalts without understanding the role of the parental basalt series, only shown well in Macquarie Island in the Southern Ocean, (and perhaps in the Romanche Fracture Zone) first time readers are urged to divert for a short time to get some knowledge
of Macquarie before proceeding. Other variants of parental magmas may exist, but the Macquarie type is the common high soda, low K variety.
Macquarie Island is an uplifted remnant of a dying spreading centre. In it's last phases a series of successively smaller degrees of partial melt of the upper mantle were produced and, probably because of their small volume, were very little modified by fractionation.
Dima Kamenetsky (J.Pet. 41, 2000) quickly realised that this series of basalts ranging from 6 - 9.5% MgO formed an impenetrable wall, with daughter products lying on one side and cumulates (non-glasses) on the other and that these could ony be the parental basalts from which all other ORBs were derived. As these parents trend toward smaller degree melt and lower MgO there is a great increase in LILE content by factors of up to 20, while the silica remains in the range 48-51%. Macquarie did not include the most magnesian, highest degree partial melts, for these we have to go to glass inclusions in spinels, to the EPR and Galapagos Ridges or to Reykjanes or Kolbeinsey Ridges where parental melts as high as 10.2% MgO may be found. These are the highest degree partial melts and are very depleted in LILE with La for example at < 1 ppm and La/Sm of <1 and are sometimes called DMORBs (depleted MORB) or "extreme NMORB". The lower degree melt magmas which are highly enriched in the LILE elements, eg, Cs, Rb, Ba, Th, U, Nb, K, La, Ce etc are termed the "Enriched Mid-Oceanic Ridge Basalts" or "EMORB". Parental magmas show a range in K2O from about 0.01% to 1.76% but when these are fractionated we find a total range of 0.01 - 3.55% K2O. Soda has a range of 1.8 - 5.8% in the 9000 volcanic glass analyses in the latest release of the Smithsonian file as shown in the PETDB database.
Five years of testing using some 14,000 analysed basaltic glasses has shown that virtually all ORBs world-wide stem from similar parents. There is a possibility that a large area in the South Atlantic produces parental magmas which are rather more potassic than sodic but with little change in other elements. Fractionation paths are not always constant, they can change somewhat with oxidation index for example, and in cases where the parental magma plane and the fractionation path are nearly parallel, appear to result sometimes in the cumulates and daughter products appearing on different sides of the parental plane. Apart from these minor complexties, it can be said that the origins, and wide range in composition of the Oceanic Ridge Basalts are now well understood and are predictable. Knowing or inferring the parental magma for a lava group means that all fractionation trends and element ratios and abundances are also in most instances predictable. No evidence of contamination by entrained lithosphere or sediment or unusal effects induced by deep-seated magma "plumes" has yet been found. Though claimed in almost every paper ever written, no undeniable evidence of variations in the basic Mantle composition has yet been put forward.
|

Drillship Joides Resolution on site
(photo: ODP) |
With the exception of superimposed alkali basalt-trachyte seamounts usually aligned along transverse fault zones and mainly non-emergent, most sea floor rocks are tholeiitic basalts originating from the mid-oceanic spreading centres. A ridge such as the Mid-Atlantic Ridge, or the South-West Indian Ocean Ridge separates at a rate of about 2-4cm/yr, but in the East Pacific Rise it may be as high as 16cm per year. The decreased lithospheric pressure allows melting to take place in the up-welling upper mantle forming basalts which are either become injected as sheeted dikes or emerge as fissure eruptions on the sub-oceanic crust forming great thicknesses of pillow basalt. In cross sections of Archaean oceanic basalts the upper 3-5m of a unit may be pillows, the lower basalt unit is massive and modern ridge basalts may be similar. A wedge of sediment lies of top of the older basalt floor increasing in thickness and basal age towards the continents, though no seafloor sediment of age greater than Jurassic has been found, the older sedimentary rock having been subducted.
|
 |
This mercator projection chart of the oceans of the world shows the locations of the approx. 14,000 glass samples in the PETDB file used in the diagrams below. The Mid-Atlantic Ridge with the Gibbs Fractures Zone and the Romanche FZ (near the Equator) is easily seen. At 100W is the Galapagos-EPR triple point. At 150E is the Ontong Java lava plateau. Note how few samples have been obtained away from the active spreading centres. The total ridge system is about 45,000nm long. This means we have one analysed basalt glass sample per 2 nm. As most samples have been collected and analysed randomly, it turns out that we need a minumum of about 4000 to get good coverage of all possible compositions. For many trace elements we have from 1000 down to as few as 10 analysed samples only (for glasses) so that in trace element diagrams below, fresh whole-rocks have been used in addition to glasses. |
The large island of Iceland is located on the Mid-Atlantic Ridge (MAR) with the MAR spreading centre passing through it. All ridge processes can be observed here, the formation of en-eschelon faults and dike swarms, the large fissure eruptions, the formation of local shield volcanoes perched on top of active rift zones, the occurrence of peripheral alkaline centres, etc. In a rational world no one would be allowed to work on MORB research without spending some months studying Iceland first. EMORB centres seem to form local shields with a high incidence of icelandites ( = tholeiitic andesites) and high Nb rhyolites or commendites., see Iceland, in OIB's.
Though there has been a great deal of work done on the sub-oceanic crust over the last 40 years, precise definitions of the range of compositions existing are only now beginning to be assembled. My first contact with this avenue of research came in 1962-63 when I analysed some samples recovered by the drill ship from Legs 2 and 3, the samples being provided by Dr Paul Gast and Dr Jean Guy Schilling. The "Challenger" and later the "Glomar Explorer" and the "JOIDES Resolution" were operated by the DSDP or "Deep Sea Drilling Project", now the ODP or "Ocean Drilling Program". Most of the samples were tholeiites (but with some trachyte) of very low K, Ba and Rb (<2ppm Rb) and with K/Rb of 1000-2000 cf the more common 3-400 found in continental or oceanic island rocks. The Ba was at about 10-30 ppm levels cf 300-500 or more in non-seafloor rocks and is was immediately evident that the ORBs were different to any other kind of basalt.
In 1972 Dr F.Aumento and I were given the use of the "Glomar Challenger" for a season and we had four of the deepest drills to be done to date south of the Azores on the MAR. These were sites 333, 332b, 333 and 334 of Leg 37. We found both NMORB and EMORB, with fractionated picrites, anorthosites, troctolites and gabbro.
Each oceanic traverse done by the drill ships is termed a "Leg", each consisting of a series of shallow drill-holes numbered as "sites". The ODP are now planning Leg 250. (year 2004).
Drill cores of basaltic rock have for many years been analyzed immediately on board ship by XRF for the major elements and for the last ten years or more for at least some trace elements, usually including Cr, Co, Ni, Cu, Zn, Rb, Sr, Y, Zr, Ce. Sample is made available to research centres wishing to do further work. Many other oceanographic vessels and submersibles have contributed to sampling, mapping and coring the sea-bed, PETDB now list 90 of these vessels operated by many countries.
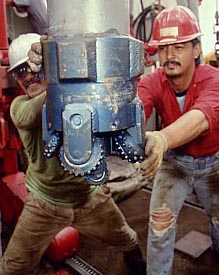 Shipboard roughnecks
preparing to spud in.
|
The ODP maintained a data base of their own data at College Station, Texas, but difficulty was always encountered in trying to merge their major element and trace element files, as they were often not done on the same sample. Their files also needed a good deal of editing as in the 1980-90's era they filled in blank cells with "XXX" or "XXXXXX" or "ND" which no computer likes to find in a numeric cell!
However, these data have all now been added to the PETDB data base, who appear to have sorted out many of the problems. petdb.ldeo.columbia.edu.
Downloading using a broadband connection is fast, search can be made on ridge sector, feature name, geographic location etc. Defining a zone by dragging on a chart representation is promised "sometime". Full references and metadata are included.
It has to be admitted that not much information as to the composition of the oceanic crust was gained from pre 1970 work (other than that low-K, low-Rb,Ba basalts predominated), either from the DSDP or the many other oceanographic ship recovery programs. This was due the fact that all samples tended to be analyzed and many of them were somewhat altered after a million years of being submerged in seawater. When it is considered that an 8,000 ton ship with a total crew of 70 may manoeuvre all day to fetch up a single spine of basalt in a chain grab, it is difficult to simply reject it on the grounds that it looks a bit iron-stained! We returned from one extensive voyage on the Canadian Oceaographic vessel "Hudson" with three recovered basalt spines from the MAR. Needless to say we did not ignore them!
Finally a careful petrographic study was made of the Leg 53 cores and the samples classified as "Fresh", "Moderately Altered" and "Strongly Altered". The differences between them especially for the potassium group elements were most marked. Of 144 fresh and moderately altered samples, 22 graded "altered" have more than 0.14% K2O (up to 1.4%) while only a single sample graded "Fresh" has over 0.15%.
While there is a possibility that rocks with a potassic matrix are more prone to alteration, the data from the fresh samples is to be preferred.
|
|
Fresh (+'s) compared with "Moderately altered" for alkali differences in samples from Leg-52. The "Fresh" samples are mainly glassy rinds on pillows etc and are N-type MORBs.. |
|
|
Comparison for TiO2. All but 8 of the "Fresh" samples show a low-K NMORB trend with MgO.
Almost none of the altered samples do but they do fall into a possible EMORB field so the case is not conclusive! However, whole rock samples always include crystal cumulates of variable composition as well as being suspect on the basis of alteration. Some elements, especially Ba and Sr are always more variable in whole rock samples.
Moral: Pick samples carefully or stick close to your desk and never go to sea! |
The next progressive step was taken by Dr Bill Melson of the Smithsonian Institute and his assistant, Timothy O’Hearn who began a program of analysing by EMP chilled marginal glasses only, these being in the main, free of alteration. Using submersibles such as the well known "Alvin", chilled basalt glass samples were collected from the sea-beds by hand or rather hand-guided probe or else selected from ODP cores. Lately techniques of towing sticky soft balls over the sea-bed seems to have been used to pick up glass fragments. Chilled glasses have been found to yield highly consistent data. The glasses recovered were analyzed by EMP (electron microprobe) for the major elements only and showed much more homogeneity than non-glass (whole rock) dredged or drilled samples. Over the last 30 years EMP analysis for the ME and for the last five years ICPMS determination of the TE of recovered glasses has become almost routine, except sometimes in cases where knowledge of the rock type is most needed, eg, when isotopes are determined. Very little information is gained when exotic trace elements or isotopes are determined on rocks of unknown type.
Characteristics of the Deep Sea Glasses
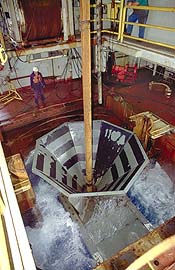
Shipboard drill string collar
(ODP photo) |
The work of Melson & O'Hearn begun in about 1975 placed the whole investigation of sea-floor basalts on a much sounder footing, almost all alteration effects and all crystal cumulative effects being removed. Data based only on recovered glass rinds showed the compositions of NMORB and EMORB melts and their fractionated daughter products only.
When I was given a diskette with all their data for about 5000 samples by Tim O'Hearn in about 1982 it gave rise to an interesting time. The first discovery was, how homogenous they were, for the major elements at least. On a ternary Al-Mg-Ca diagram, all plotted in a tiny triangle bounded by 20% MgO, 40% Al2O3 and 30% CaO. Even now when many more data are available, one can plot 12,000 MORBs and find few if any that plot outside the "Basalt Triangle" as I termed it, (see below).
Separated into North and South Atlantic, Pacific, Indian Ocean or Red Sea origin, makes no difference. Obviously, this composition represents a low temperature cotectic for rocks derived by partial melting of mantle.
For the major elements (ME) only the Mg-Fe and some the minor element pairs such as Ti, P, K, Na, showed an often very wide and apparently meaningless spread of composition, for example samples of the same MgO content could vary from 0.3 to 3% in K2O or from about 1 to 5% TiO2, or from 10 to 50-60 ppm Nb. Some groups seem to show fractionation effects, others seemed to be just randomly variable.
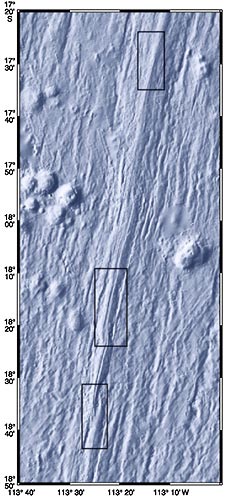
Relief map from "Sinton et al.:
Mid-Ocean Ridge Volcanic Eruptions"
The median trench can be seen, also the off-ridge seamounts
and what appear to be diagonal shear zones. |
Fractionation Effects
Melson & O'Hearn's earlier data included obvious fractionated series of ORBs from the EPR and the Galapagos Rise which included rhyo-dacites and rhyolites, but even selecting from an area only miles across between 1.0 deg lat, and 1.2 deg N the different iron levels of the ferrobasalts showed that more than one lineage was present. Unfortunately, there were no trace elements for these samples.
The next step forward did not come until Regelous etal (1999, J.Pet.) found more or less by chance a complete set of fractionated NMORBs while doing a cross-section of the EPR at 10 deg north of the equator. The samples ranged from basalt through ferro-basalt and icelandite to a low silica soda-dacite and a wide range of trace elements done by ICPMS were included and, even more important, the samples were mainly glasses. While similar in trend to other partial series already found, and to OIB fractionated rocks, for the first time we had an unequivocal fractionated series which showed not only the trace element trends but the degree of enrichment that could be found between basalt and ORB dacite. The EMORB-normalised multi-element fingerprint diagram (see "Oceanic Basalts of the Pacific", "EPR") showed the trace and minor elements to increase with fractionation in an almost pefectly parallel manner. Coincidentally Dr Michael Perfit in the same year also recovered a fractionated sequence, also of NMORB, from the Galapagos Rise at about 85 W, (Perfit etal, 1999), in fact some were recovered in 1988 but only 2-3 of the samples were analysed for the TE.
Put together with other, less complete fractionated series, the
results looked like a string curtain in the wind, with parallel
fractionated series stemming from different parents. As the different
parents differed sharply in their LILE content, but were not of
lower silica as alkaline rocks are, differing degrees of partial
melt of the mantle seemed a likely candidate for explanation of
the phenomenon. But how were we to fix the exact composition of
these parental magmas and what was their range?
Parental Magmas of the ORB
The more enriched of the oceanic ridge basalts (the EMORBs)
tend to occur in off ridge seamounts or along very slow-spreading
or failing ridges. Vadim Kamenetsky etal (2000, J. Pet. 41 ) examined
in detail a series of small volume melts found on a relic island
on the failed and now quite inactive Macquarie Rise, SW of New
Zealand. Though many showed effects of fractionation, others were
found to be quite unmodified primary melts with a very wide range
in LILE content showing usually linear trends often at high angles
to the known fractiontion trends. For more discussion on this,
see "Macquarie Island" in the OIB chapter.
|__| Click here to download the Parental magmas from Macquarie Island. Plotting various element pairs, eg, K/Th quickly shows why this ratio is so invariant in Oceanic basalts bearing in mind the fact that Plag + Ol contain virtually no Th or K and that that a fractionated series must be aligned between the origin and a possible parental magma but projecting beyond it. Other element pairs, eg Zr/Nb or Ce/Zr will show why the variation in these elements is so wide.
The compositions of the parental magmas were now defined, and it soon proved that all compositions of ORB rocks lay between the boundaries of their parental magmas and the paths of fractionation of the extreme NMORB. EMORB higher fractionates tend to lie close to an extention of the parental melt trend.. This seems to apply to all elements and we show the compositional boundaries of some of them on a series of diagrams below. No lower degree melt, more highly LILE enriched EMORB than the most enriched Macquarie rocks have yet been found, (except for K) but while the higher degree melt members are quite depleted, they are less so than some extreme NMORBs found in the EPR, and on Kolbeinsey and the southern Reykjanes ridges. The Romanche Fracture Zone apears to show another parental series, of lower K, Cr, Rb, Ba, U, Th, Nb, La, Ce., and higher soda. We now have to face the fact there also seems to exist, eg in the potassic South Atlantic, another series or parental melts more potassic than Macquarie. We shall see!
|
 |
These are the non-log scale parental melts from Macquarie, normalised to EMORB. They are relatively low K, with Cs, Rb, Ba, Th, U, always higher throughout and with Nb>>K. They apparently represent the most widespread magma type world-wide. |
 |
Near-Parental Magmas from the South Atlantic, from Petrus le Roux etal, 2000. Ba and K show high peaks relative to low Rb, Th, U, Nb. These rocks with < or >1% K2O at 7% MgO have approx double the K, Ba//Nb of their Macquarie equivilent. Spiess Ridge Seamounts near 70 deg S have a simillar pattern. We see that while Ba is relatively high cf Th, Nb in EMORB compared to NMORB, (see diagram above), it becomes Ba<Th in depleted members. BUT, the K remains always higher than Nb. The Rb, Th, U, Nb, Pb remain "normal", but the K is elevated throughout the whole 40 - 52 S region. |
 |
The fractionated NMORB series from near 10
deg N by Regelous et al, 1999. While patterns are accentuated
by fractionation, they are not reversed, in fact on a log
scale (see Pacific ORB chapter) they do not change. Note distinctive
pattern typical of all EPR, GR, NMORB. Remember this is a
fractionated series, the lowest
members only are close to parental
melts. |
| |
The best examples of fractionated median EMORBS are to be found in the Galapagos Islands which have twenty times the Nb of a fractionated NMORB from the adjacent Galapagos Rise. |
World Wide Oceanic Basalt Compositional Ranges. |
 |
Variation diagram for 22,481 ORB basalts including all glasses and whole rocks of which some may be slightly altered. While of little use petrogenetically this diagram may give a better representation of the actual bulk composition of the sea-floor. This is still a sampling rate of one sample per 4 km of spreading centre on average. |
 |
All Oceanic Glasses from PETDB. MgO vs Oxides. (Jan.2005) We originally had to do some hacking to get this file downloaded in about 2001, but the latest version of PETDB has no limits on file sizes though time-outs may be frustrating.
The variation diagram is very distinctive, and quite different
to Arc or OIB series. Fractionation proceeds from high magnesia
basalts on the right towards low MgO rhyolites on left. The
vertical spread in composition is caused by the range of parental
partial melts, which lie between about 10.5% MgO and 6% with
with slopes that differ for each element. (see below) |
 |
All oceanic ridge fresh whole rocks. Some of
the high alumina sample are plagioclase cumulates, but the
number of ferrobasalts present are less than are seen when
glasses only are shown. Also notice minor number of picrites,
mainly from Leg-37 at 37N, MAR. |
 |
Metals for all ORB whole rocks. Notice little variation in Co, Zn and Cu. V follows the fractionation - partial melt confines exactly. Ni is more variable than we might expect as is Cr, the plane of parental melts lying flat across the range shown. There is almost no sign of sulfide mineralisation. (Jan.2005). Kamenetsky had now produced metal data for Macquarie, and primary magma Ni trns cross the fractionation trends at a high angle. By contrast for Co, primary magma and fractionation trends are nearly parallel, hence the very minimal variation. |
 |
Alk-Earths for all ORB whole rocks. Note the
Nb < Y (also Nb<Rb) seen in all ORBs and also in CFBs
derived from sub-continental mantle.
The wild Ba and Sr is due to the sharp increace in these elements
in lower degree melts, plus their large variation with fractionation.
It may however exceed the Fractionation - Partial melt boundaries
in non-glass samples+. The important point is that the wild
Ba - Sr seen in both CFBs and in Arc andesites seem to be
inherited from the original mantle partial melts |
 |
All of PETDB's Oceanic glasses.
MgO histogram. Fe-Mg fractionation is almost universal, hence
the spread. |
 |
All of PETDB's Oceanic glasses. SiO2
histogram.
Silica, as well as the ratio of MgO, CaO, Al2O3 varies very little in oceanic basalts world wide, the mode for silica being close to 50%. (See "Average Oceanic Crust".) NMORBs have up to 52% silica, EMORBS as low as 47-48%. The composition of the cotectic at which mantle rock melts varies slightly with degree of melt, even for major elements. It varies enormously more for trace elements as could be expected. |
 |
Ternary Al-Mg-Ca diagram for 2,664 whole rock
basalts etc from all oceans, Petros File, mainly pre-1975
data. The majority are undifferentiated basalt, some peridotite,
a few picrites mainly from Leg-37 ODP, ferro-basalt and icelandite
mainly comes from the EPR-Galapagos Rise. All scattered points,
low Ca points etc are altered rocks |
 |
2000 glasses from the Deep Sea File data of Melson & O'Hearn, for Al-Mg-Ca dating from about 1980.
+
= N Atlantic.
x = South Atlantic,
o = Pacific.
We can see there is essentially no difference between
the major spreading centres.
The trail of points leading towards the Al corner are
fractionated EPR rocks, the 25 others slightly left are EMORBS,
either from off-ridge seamounts or the slower-spreading ridges.
4 wild points defy explanation. The great majority of the
1950 points are NMORBS and lie in the "Basalt Triangle"
and define the cotect point at which the mantle melts. The
small spread east-west is due to differing degree of melt.
With olivine-plagioclase fractionation the ratio of Mg-Al-Ca
says fairly constant. When joined by clinopyroxene at about
6% Mgo, (which removes Mg,Fe,Ca, but not Al), some Al2O3 enrichment
may be seen. |
 |
Ternary diagram for Al-Mg-Ca for 10,793 MORB
glasses. (June,2003)
Fractionates have a kink at the TMt point, then trend to high
silica and Al.
Again, different degrees of partial melt broaden the low T
co-tectic, but the overall range is small. |
 |
Ternary diagram for Fe-Mg-Ca for 2,914 MORB glasses, dating from about 1982. All are either undifferentiated basalt or ferro-basalt-icelandite. This diagram show the fractionation of Fe-Mg well, though the extent is much greater in the depleted, high-degree melt, NMORBs
Note complete absence of picrites, so that picrites must be mainly cumulates. Ferro Basalts are mainly from the EPR (East Pacific Rise) and the Galapagos Rise with a few from the South Atlantic. Also note absence of alteration scatter and restricted composition except for the Fe/Mg fractionation effects. |
 |
FeOT - MgO - CaO Diagram for 10,793 ORB glasses from the PETDB database, including most of those shown above from the Smithsonian MBF file. (June, 2003). The EMORBS to the left show less fractionation. (There are now ( March, 2006) over 14,000 glasses available but no change is expected)
Note that we have now switched to showing total iron as FeOT
(instead of Fe2O3T) as being closer to the real rocks which
changes the location of the points somewhat.
Note also the presence along the margins of some samples lacking
a component. The reason for analysing a basalt glass by EMP
but leaving out a major component is not known but, with all
repect to those concerned, cannot be regarded as "good"
science.
The wild points should not exist as neither God nor oceanic
basalts monkey with minimum melting point cotectics and Fe-Mg
fractionation. We assume altered palagonites have been analysed.
The thickening at the base is due to the different (Fe+Mg)
/ Ca of smaller degree melts. A very large percentage of ORBs
show Fe/Mg fractionation effects, a very small number show
higher degrees of fractionation, which does not show up well
in this diagram in any case. |
|
Silica is almost invariant (see histogram above) declining slightly from 52% SiO2 to about 48-49% in the more enriched EMORBs. An Al2O3- (Fe+Mg)-CaO plot also shows a tight grouping. Fe-Mg-CaO shows a range of iron composition with fractionation of ferromagnesians from Mg basalt to what was called FeTi basalt, enriched in Fe, Ti and V with lower Mg. True ferro-basalts with more than 14% FeT are rare outside the Galapagos Rise, East Pacific Rise area. As we found in the mid 1980's, the minor elements Ti, K, Na, and P vary quite widely, not always in sympathy. Soda shows some remarkable groupings with some areas with sometimes only about 2.5%, (eg, Kolbeinsey Ridge) with others about 3% (22N) and as high as 3.5 (Mid Cayman Rise). Some samples shown below have up to 6% Na2O. The different groups seemed to be arranged en-echelon fashion as though stemming from a series of primary magmas of different Na, K, P, Ti content. It is only since 2001, with the help of the data of Kamenetsky et al, (2000) that this has been proved beyond doubt, the high soda magmas being the lowest degree partial melts.. The K2O goes up steeply in the smaller degree melts at almost constant or slightly declining silica, but at the TiMt point, silica increaces sharply in fractionated series as shown in the next diagram. This is because the total cumulate of plag+cpx+timt has less silica than the melt being fractionated.
|
|
K/Silica for Galapagos Rise glasses.
Mainly depleted high MgO basalts but west and north of the Galapagos Islands are a series of ferrobasalts, icelandites rhyodacites, low silica (70%) rhyolites as shown.
Two clusters appearing immediately above the Fe-Ti differentiated rocks with about 50-51% silica but higher K are almost unfractionated EMORBs. Other series from the nearby EPR (eg, Regelous, 1999) trend more or less straight from the top of the Mg-Fe differentiated series towards the rhyolites.
|
 |
All available REE for basaltic glasses, from PETDB, (06-2004). More than 6000 are shown below but those are mainly whole rocks, not glass. One or two Nd points seem to be in error but the glasses show little analytical or sample scatter. Note the wide range in Nd, from ~= to Ce for depleted NMORBs, to about half Ce for enriched EMORB. |
 |
All ORB Clinopyroxenes mineral variation diagram. |
Primary Parental Melt and Fractionation Trends
To date some 37,000 ORB WR + glass samples have been at least partly analysed if we include partly altered samples as well, and while the compositions are monotonously uniform for some major elements, esp. Si, Al, Ca, it is usually found that Fe,Mg may vary in opposite sense by factors of 3-4, while the minor and trace elements show what appear to be wild variations by factors of up to 100. However, these it has been found, follow simple rules, and given one or two basic facts about a sample the minor and trace element composition can be predicted with some accuracy.
 |
Variation in isotopic and element rato with degree of melt.
Pb206/204 vs Pb208/204 is shown for Macquarie rental magmas. This
diagram, shown at the AGU in 2002, shows how other average geochemical
parameters including Zr/Nb and La/Sm vary in sympathy with Pb isotopic
variations, (also with Sr - Nd isotopes). The Macquarie Isotopes
are from Kamenetsky,(2000, 2002) with two averaged additions for
NMORBs from Kolbeinsey and Reykjanes Ridges. |
In the total range of ORBS yet sampled fractionation effects affecting only the Fe/Mg ratio are common, presumably because these can happen by displacement of olivine and cpx while magma is on its slow way upwards or perhaps by the jacketing of wall rock olivine. More extensive fractionation leading to silica-enriched icelandite and rhyodacite, even to ferro-basalt is relatively rare, presumably because such processes require a lengthy time of delay in a sub-crustal magmas chamber and large magma chambers are not easily formed in rock of such high density in regions of thin heavy crust.
In the Pu'u O'o lavas of Hawaii, samples collected from near the vent may have analysed glass matrices up to 2% higher in MgO than the same magmas samples 10 km away near the sea coast which contain microlites of olivine and have a temperature perhaps 10 degrees lower. However, subaereal or even lava-tube cooling must proceed faster than sub-crustal cooling.
The sometimes wide range of minor-trace element compositions as seen in ORBs always lies between well defined boundaries being confined by the trends formed by primary magmas of differing degrees of partial melt of the parental mantle on one side and the path of Fe/Mg fractionation sometimes extending on to rhyolite in the more depleted NMORBs on the other.
Fractionation of the most enriched EMORBs is quite rare but when it happens it forms an extention of the ORB parental melt trend and is far from parallel with that for the high-degree melt magmas. This peculiar pattern of points is confined between two arms diverging by a few degrees in elements adjacent in the "SM" series described immediately below, but may diverge by up to 80 deg in two elements widely separated in the "SM" series and is invariably seen in any pair of elements from any randomly acquired suite of sea-floor rocks. Fractionation of more enriched ORBs leading to rhyolite are seen in both Iceland and in the Galapagos Is.
The "SM" Series
In 1989 Sun and McDonnough arranged the trace elements in order of their compatibility which is equivilent to the average partition coefficients for the main mantle minerals olivine, plagioclase, (spinel), garnet and clinopyroxene. This order, used in the many mantle or EMORB normalised diagrams in this text is:
Cs, Rb, Ba, Th, U, Nb/(Ta), K, La, Ce, Pb, Pr, Sr, P, Nd, Zr/(Hf), Sm, Eu, Ti, Dy, Y, Yb, Lu
Ta is so close to Nb and Hf to Zr in their behaviour that they are usually not included.
When one considers that there was not a great deal of good data about in 1989, Sun and McDonnough did remarkably well and this arrangement still stands. Some writers do use a different order or interpolate other elements, but when they do coherence is lost. The "SM" series allows us to predict a great deal about ORB compositions. In fractionated rocks all of the elements in the series are highly incompatible and very much concentrated in residual liquids, such as rhyolites, but the heavy or "High Field Strength" elements are slightly more retained in the cumulates, giving a slight curve to fractionation diagrams.
In a series of parental magmas derived by differing degrees of partial melt, the HFSE (high field strength elements, on the right) show average partition coefficients of about 0.5 and change very little in their fractionation characteristics from NMORB to EMORB, but the LILE (on the left) may be a hundred times enriched in extreme EMORBS/NMORB parents compared to x 6-8 in the rhyolite to basalt of fractionated rocks. Lower degree of partial melt is thus about 50 -100 times more effective in concentrating the LILE when compared to crystal fractionation.
Elements which are close together in the "SM" series always show reasonably good correlations, eg Rb-Ba, or U-Th, or Th-Nb, or La-Ce, or Yb-Lu as well as many others not shown, eg, Mg/Co, Os/Ir. Elements wide apart, eg Yb-Rb, or Y-Ba never do unless they are members of a related fractionation series.
Partial melt effects are much greater than fractionation effects for the LILE, while the reverse is true for the HFSE, (Yb, Lu etc). For those in the middle of the "SM" series, eg La, Ce, Pr, Sr, Nd etc, the two effects are about the same.
 |
The range of primary magmas of differing degree of partial melt as shown by Kamenetsky etal (2000), with two more depleted higher degree melt samples from the Kolbeinsey Ridge. Note however that the latter have higher high field strength elements (HFSE).
Obviously the ratio of say, Rb/Lu increases continuously and for any two elements the change will greater the further apart in the SM series they lie. |
Interelement Correlations in ORBs
- Fractionation effects
Interelement correlation in a fractionated series stemming from a single parental magma, (e.g., see data of Regelous etal,(1999) for the equatorial EPR), have usually very high correlation coefficients for all pairs of residual elements of 0.95 or better. The trends almost invariably pass through the origin or close to it, so ratios remain constant, e.g. for Zr/Nb, Rb/K, La/Lu, La/Sm. This is due to the very low partition coefficients of all of these elements for the early formed minerals, olivine, plagioclase and clinopyroxene which accordingly would plot at or close to the origin of any interelement graph except for La/Sm which due to involvement of Cpx which takes in Sm, may diverge slightly. For the possible range of interelement ratios see diagrams below. The sequence of fractionation is, first of all olivine in the most magnesian high-degree melts, followed by Ol + plag, followed closely by Ol + Plag + cpx at about 8% MgO, then at 6% MgO by titanomagnetite and at about 4-5% MgO, apatite. Lack of good related fractionated series for the more enriched members means that fractionation paths are still not well defined ( April, 2005). - Partial melt effects
Rocks of differing degrees of melt without fractionation or any post-formational modification show perfect linear interelement correlations usually better than 0.99, (Kamenetsky etal, 2000). These often do NOT pass through the origin, so the ratio may change rapidly between magnesian high-degree melts to the more iron-and LILE-enriched low degree melts. E.g., Zr/Nb may have ratios of ~50 down to <4, La/Lu from ~150 down to 0.3 in different parental melts. As may be seen from the multi-element normalised plot for Macquarie Island, LILE elements increase by a factor of 100 or more while HFSE elements remain about the same as we go from NMORb to highly enriched EMORB.
For the LILE elements, the range is extreme in these primary melts, Rb has a range of <1-60ppm, Ba <10-584, Cs 0.047-0.654, Th 0.494-5.26, Zr 55-163, Nb 7-91. In fractionated EMORBs Nb could go higher than 300ppm, as could La but even in the year 2005 there is little data..
Combining these two effects which may have paths at high angles to each-other, can produce a seemingly inexplicable chaotic display of data points.
The ORB Rule for Interelement Correlations
This may be stated as:
In any set of Oceanic Ridge Basalt samples, if they stem from a common
single primary melt and are affected only by fractionation, correlations
between any two residual elements will be high. If several parental
magmas of differing degree of melt are involved (which is usually the
case) and the fractionation and melt trends for any two elements diverge
at a high angle, correlations will be very low, e.g. for Zr/Nb, La/Sm.
In a mixed series of rocks only those elements close to each-other on
the "SM" series will show any degree of correlation. Those
elemts that reach sub-ppm levels in depleted NMORBs, usually show a
narrow V distribution.
The diagrams below show the boundaries and extent of the compositional range for a number of ORB element pairs.
 |
Nd-Ce diagram for both parental melts and for a depleted fractionation series from the EPR. These two lines as shown define the the greater part of the range of all ORB basalts for Nd and Ce with exception of some samples even more depleted that the EPR samples of Regelous etal, and which consequently plot below the EPR line. As Nd is the "Less compatible" element, the fractionation series will branch to the right from the parental melt stem. As it in this case an NMORB the fractionated branch will extend from near the base. Fractionated EMORBs branch from higher up and at a smaller angle to the parental melt stem, directly away from the crystal cumulates near the origin. All ORBs should lie between the two arms for these elements with the exceptions pointed out above. |
 |
Nd-Ce for all ORB rocks. Because trace element data is available for only a few hundred basalt glasses this diagram includes whole rocks and a few altered wild points are present but all but <1.0% of points lie between the limits given above. The EPR series is not the most depleted, highest degree melt known, and a few points are outside this line near the base so may be real. (nb, the "EPR fractionation trend" is incorrectly plotted outboard of it's real position. This will be corrected, DV and WP, (Aug,2003)) The possible range in the ratio Ce/Nd is about 1 to 2.6. |
 |
La-Nb for the parental melts and the EPR fractionated series. Again, all ORB rocks should lie between these two limits for these two elements. However, again the EPR trend lies well within the limit for the largest degree melt NMORBs and the real limit is near where shown by the dashed line. |
 |
Sm-La for all ORBs. Again the less compatible element is shown as the X axis. The two boundaries of the parental melt trend and the EPR fractionation trend are drawn in. A band of points of low La lie below the EPR fractionation trend, as these are quite regular, they are again fractionated members of series more depleted than the moderately depleted EPR group.
Notice the curve of the cumulates near the origin. It seems the gabbroic cumulates become progressively more depleted in the most incompatible element. These do not show in a "glass only" diagram. The possible range in La/Sm is 8 to about 1 over much of the range, but in NMORBs can become <0.5 in the most depleted rocks. If we plot two extreme elements such as Yb-Rb from random samples, the two trends (fractionation and parental melt) diverge at about 80 degrees, and the whole screen is covered in random points. The difference between adjacent elements on the "SM" series is not constant, some, e.g. Th-U or Yb-Lu have trends that barely diverge at all while the parental melt and NMORB trends for Sr-P diverges at an angle of about 30 degrees.
|
 |
In spite of the small range usually seen and the perfect correlations so often shown in small groups of MORBs, the total Ce-La dispersion in this diagram of all analysed ORB glass and whole rocks is quite large. The limit for NMORB fractionation is taken from the average of the most depleted rocks of Kolbeinsey and Reykjanes Ridges.
Rather surprisingly about a 100 samples lie outside the upper bound and about 50 below the lower, a total of 2% of the whole 6,890 samples. However unfortunately all data are included in the PETDB file and early determinations of La by INAA were often grossly in error. The mean Ce/La ratio for all ORBs is 2 but at sub 10 ppm level the largest scale melts have a ratio of 3. Any greater than this must be suspect, though there may be occasional examples of even larger degree melts not yet authenticated. When restricted to glasses the range shown is much smaller, but few fractionated EMORB glasses have ever been analysed for REE.
About half the field is overlapped by the OIBs and many of the more La enriched samples are from seamounts, which may be off-ridge EMORB but in some cases include alkali basalt-trachyte, as do some of the Foundation Seamounts off the American-Antarctic Ridge, (Hekinian 1999). However even the nephelinites of Tubuai in the Austral Is. do not have a Ce/La ratio less than 1.6, and other than in such rocks as carbonatites, no more La-enriched rocks are known. Pre-1980 data which included rocks given as Ce/La~1 were later shown to be in error.
Allowing for the possibility of occasional very depleted large scale melts with less than 1 ppm La lying below the lower limit, the probability is high that more than 99.5% of ORBs lie within the bounds given. |
Test Questions:
- Zr and Rb both concentrate in rhyolites and trachytes. If we were given a large number of samples from a hundred mile length of mid-ocean rise, would you expect to find a good correlation between the analysed Zr and Rb?
- Plotting Zr as Y against Rb as X, on which side of the parental melt stem would the fractionates lie?
- What would the correlation coefficient be likely to be? Why so?
Few people seem to appreciate the wide divergence of elements of different parentage which are widely separated on the "SM" scale, with the result there are many wild appeals in the literature to "Mixing of magmas", "lithospheric contamination of magmas" , even "sedimentary contamination of magmas", "metasomatised Mantle" etc.
 |
The correlation between Zr and Nb is important because the ratio varies systematically not only from NMORB to EMORB rocks but between tholeiitic and alkaline. In the two series the range overlaps being from >50 down to less than 3 for ORBS and about 12 in island tholeiites down to <3 for basanitic or nephelinitic OIBs. This diagrams show the minor fractionation seen in some of the Macquarie samples quite well. Crystal cumlates lie near the origin, so that the fractionation trends including that of the EPR have constant ratios. |
 |
The explanation of the spread of data points for CaO relative to MgO in 10,580 ORB glasses took some time to solve due to the curious flattened high temperature termination between 12 and 14% CaO. The most depleted large degree melts lie at the magnesian end at ~ 10.2% MgO as usual and the plane of partial melts, as indicated by the Macquarie samples lies along the lower edge down to 6% MgO, though the Macquarie samples show some early scatter in CaO. Here also there seems to be a more than 100 points spilling over the partial melt plane, whether this is analytical or whether a degree of super-heat allows some remelting of phenocrysts phases as lower pressures is not known.
Some very low CaO samples are labelled “Old oceanic crust” and are undoubtedly altered as are a few high CaO samples. The EPR fractionated series (Regelous etal, 1999) lies near the upper boundary but separated from it by some even more LILE-depleted but Ca-Fe-Ti enriched rocks as found in Kolbeinsey, Reykjanes and Nazca ridges.
The upper right edge is formed by depleted NMORBS fractionating olivine plus plagioclase. It is often not well defined, in some series, eg Galapagos Rise, this bound is flatter, suggesting there may be some variation in the ratio of separating Plag-Olivine. At 8% MgO with the incoming of clinopyroxene, the fractionation path is deflected sharply downwards and follows the usual path of about 14% Ol, 54% Plag and 32% Cpx cumulate.
Beyond ferrobasalt the trends for NMORB and EMORB converge bringing “Icelandites” of from <1% to >3% K2O together. There is really no name for the highly LILE-enriched derivatives of EMORBs which may have a Zr/Nb of <3, quite unlike the Icelandic intermediate rocks where Zr/Nb is about 12 or higher. On a silica/alks diagram they plot in the hawaiite or tephri-phonolite areas.
|
 |
Soda as shown above is found to exhibit different levels at different sites. Soda can in fact range from <2% to >6% in ORBs with a combination of both partial melt and fractionation effects. Fractionation trends are horizontal to slightly negative in slope suggesting that in the cumulate ol + plag, plagioclase is dominant, |
 |
Na2O/K2O ratios. The highly variable Na/K ratios seen not only in ORBS but in OIBs and also arc andesites have long been a source of controversy. However, once again we find more than 98% fall within expected bounds. A few extremely low compositions are either errors or altered palagonites. A large number clustering on the wrong side of the partial melt plane could well be altered as both Na and K are not highly stable, or again could be refused cumulates. However most are far too high in K to be cumulates so we conclude they are probably altered somewhat, though soda determinations by EMP 30 years ago was far from precise. Again the EPR fractionated series lie well within the high soda fractionated NMORB limits.
Recent data of high quality from very depleted NMORBs, eg those of Murton et al, (2003, J.Pet), from south of Lat 60N on the Reykjanes Ridge show a compact wedge of samples, all lying on the high soda side of about 1.8% Na2O at very low K, even though their MgO barely exceeds 9%. A good deal of more precise work of this kind is needed here.
We can see the great similarity in spread of Na and K to that seen in the OIBs.
|
| |__| |
Separate Na/K diagram for the fractionated EPR, showing a well defined deflection at about 3.3% Na2O; an identical path is followed by Cs, Rb, Ba, Th, U. This deflection occurs at 5 – 5.4% MgO, 3.0% TiO2 (before the TiMt IN point), 15% FeOT, and 10% CaO. Sr shows a downward flexure, Al2O3 upwards ( seen on variation diagrams as a flattening of the Mg-Al2O3 trend), Sc turns downward. Though constant in all depleted series it is puzzling as it does not appear to coincide with any incoming of a major phase. A sudden increase in K, or decline of soda seems to occur without any major change in CaO or Al2O3. It may be the point where olivine ceases to form. This flexure in Na-K occurs in all depleted MORBs and in all tholeiitic OIBs. |
|
|
K2O-MgO diagram for 2,739 basalt ridge glasses, (first plotted in about 1985, with slightly less data)
(+) from Melson et al, (2002, G-Cubed) together with the trends of the partial melt series (o) from Kamanetsky et al, (2000). The trend of the EPR (Regelous et al, 1999) is shown (x), but a distinct fractionation-related group from the East Galapagos Spreading Centre, (or Cocos-Nazca Ridge, or Carniegie Ridge) and partly from Site 504B is even more depleted.
Note the glasses do not (except as below) cross the partial melt plane. This then represents the entire spread of possible tholeiitic MORB compositions, unless an even more depleted set is found. Some of the most basic glasses do cross the extention of the partial melt plane. Do very basic partial melts take a swing towards higher olivine content at very depleted, high volume partial melt levels? ie, does the melt path leave the Al-Ca-Mg (Ol or Opx + plag) cotectic and pass into the olivine field?
The mode for MORBs is at 7.5% MgO as we can see. Why not closer to the primary partial melt plane? Presumably most have loss some Olivine + Plag before extrusion. The presence of so many FeTi basalts shows this must have occurred.
|
 |
In the second K/Mg diagram (dated June, 2003) a few high Mg alkaline rocks or altered palagonites may be inadverdantly present. The most fractionated EMORBs have about 3% K2O compared to 0.3% in the ferro-basalts at 3% MgO. It is a great pity no ICPMS work has been done on the more enriched members. One would suspect a Zr/Nb of 2-3. as opposed to 30-60 in the depleted members and at least 200 ppm Nb. |
|
Cs, Rb and Ba show similar distribution against MgO as K does but the plane of partial melt is much steeper, almost vertical so that the scatter of points in random samples is even greater. No wonder so many people studying a small handful of randomly collected ORB samples are baffled by their lack of correlation. Sr shows very similar distribution to Ba and these two elements not only are highly variable in ORBs but also in OIBs and in the andesite series.
Perhaps more surprisingly, Sr and Ba show a much wider dispersion in whole rocks compared to glasses, more than almost any other element. When we worked on the Cape Verde Islands many years ago we did multiple samples from single lava flows for Sr and Nb and found wide variations. Why are Sr and Ba so mobile? |
|
|
Total possible spread of Fe(t)/MgO for all MORBs. This diagram dates from the year 2000 though first studied in about 1985 but later added to.
o = Partial melt parents, (Kamenetsky et al, 2000)
x = EPR, (Regelous et al, 1999)
* = Cocos-Nazca ridge. (Melson, et al, 2002)
Note the fractionation trends peak at 4% MgO at the TiMt (IN) point and thereafter declines. Unfortunately data are from mainly random samples and fractionation trends cannot be positively drawn in except for a few known localities, (EPR, Gal. Rise, Nazca Ridge, 21N, Kolbeinsey Ridge etc.),. Samples falling in the center have often been described as being the product of "mixed magmas" but are merely the product of intermediate degree of melt. Some samples have higher Fe than the Cocos-Nazca (Galapagos) Ridge. Are they fractionates from the very basic samples on right? Or is this an oxidation complication? (Fe is shown as total iron). |
 |
Diagram 2. Update July, 2003. A few points below the partal melt plane are inexplicable. Those to the right are alkali-basalts. Why do most not fractionate beyond 14% FeOT? Differences in P O2? Notice the low iron (6%) in the fractionated EMORBs compared to the 18% in the fractionated NMORB ferro-basalts at the same MgO content. |
|
|
TiO2/MgO for 2834 MORB glass samples. (Diagram dating from 2000)
Here we have an inexplicable conundrum. The Partial Melt series from Macquarie (Kamanetsky, 2000) appear to be too steep and almost parallel to the fractionation trend. From the fractionation trends seen it should lie almost horizontal. The ratio of Ti/Fe does go up in the more enriched EMORBs but not as steeply as shown. Yet in the MORB normalised diagram for Macquarie, Ti is in reasonable accordance with nearby elements. So where do the points at 5-6% MgO, and less than 1% TiO2 come from??? Yet another problem. |
|
|
Diagram 2, July 2005. Fe/Ti for 9340 glasses. It would seem from this concentrated distribution that the partial melt plane would lie along the base as shown. The Macquarie samples are somewhat erratic for TiO2 with all but 4-5 samples showing some incipient fractionation of Fe,Ti, and so the partal melt plane cannot be located precisely but is approximately as shown here. How do we explain the large number of samples lying below the parental magma trend? Very magnesian parents, see diagram of Kamenetsky below, with MgO greater than 10% have TiO2 less than 0.5% and the first fractionating phase is olivine only. At some point this is joined by plagioclase and then by clinopyroxne. The trends are not distinctive enough to be able to caculate the phase ratios, however even 50% fractionation of Ol+Plag+Cpx cannot raise the TiO2 content above 1%, so at least some of the low TiO2 points are explained. We do not know the fractionation phase mixture for the EMORBS either. |
|
|
MgO / V diagram for all fresh whole rocks, PETDB file. Few glasses are analysed for vanadium so that some crystal cumulates are included, but the similarity in distribution to TiO2 is plain.
The blue line is the closely approximate position of the plane of partial melts, the primary undifferentitated magmas. The high degree partial melts on the right fractionate to ferro-basalts with the highest (650 ppm) V, the enriched, low degree partial melts to the left have low V (and Fe and Ti) in the fractionates.
The presence of the low V samples near 6% MgO is difficult to explain, we can only assume alteration. |
|
|
P as usual refuses to conform also, (diagram dated 2000). The P2O5/MgO slope for the partial melt series is steep. The EPR and Galapagos trends do not lie near the depleted edge as for K, Rb, Na etc but in the middle. P often goes off on independent trends as seen in the Columbia River CFBs for example. However, P.Hooper (pers comm) assures me that much P data is unreliable by both XRF and by EMP unless a Germanium monochromator has been used. As some of the data goes back to 1973, there is the possibility of analytical uncertainty. Note also a few points lie on the "forbidden" side of the melt plane.
The "Apatite Point" occurs at about 2% - 2.5% MgO, the points at 1.8% levels and under 2% MgO are descending from peaks not shown at 1.2% P. The "rhyolites" with less than 1% MgO have only <0.1% P2O5. Alkali Basalt series also peak in P at 0.5 to 1.25% levels.
Wanted: A good fractionation trend series for an EMORB. |
 |
Diagram No 2, (July,2003) shows that the partial melt plane for P as shown by the Macquarie parental magmas lies as given.
The wide range in P found in most ORB studies is thus explained. |
 |
K2O vs TiO2 for all ORB glasses. |
 |
All ORB glasses. MgO vs Cr, Ni and Zn. These metals also show a wide dispersion due to the different amounts present in NMORB-EMORB. Unfortunately Kamenetsky et al, (2000) did not include these elements in the original Macquarie work and we only have a small number of metal determinations done on glasses. The location of the partial melt plane for Zn can be plainly seen on the upper surface between 10.2 and 6% MgO. That for nickel almost certainly lies at 175 ppm Ni at 8% MgO, sloping somewhat left so that EMORBS will have less Ni. The Cr partial melt plane may be parallel but the high Cr samples above 400 ppm are something of a puzzle but almost certainly indicate the presence of sulfides. At least some of the same samples have erratically high Ni.
(Nb Cr, Ni, Cu, Co, Zn data has now been added for Macca, (Dec.2004) Primary melt trends are in fact much as guessed above).
|
NMORB-EMORB Frequencies
The frequencies of depleted compared to enriched ORBs has never been determined. However some element ratios such as La/Sm or Nb/Zr are constant for any fractionated series and vary only with the composition of the parental magma.
The diagram below shows the frequencies of a range of La/Sm for 1630 analysed ORB glasses. A small number have La/Sm < 0.5, 20% have La/Sm < 1 and 80% have it < 2. If we arbitarily make the boundary between at La/Sm = 2, then only 20% of Ocean Ridge rocks are EMORBs. The absolute amount of Nb or the Zr/Nb ratio gives a similar dispersion.
The mean for La/Sm ratio all available analysed ORB glasses is 1.5.
 |
The La/Sm cumulative curve for 1630 ORB glasses. |
Volatile Elements (Cl) in Inclusions and in ORBs
 |
|
 |
|
 |
Kamenetsky has developed techniques for the study of the compositon of trapped magma inclusions within crystals of chromite which have a great advantage over olivine inclusions, as the the continued extraction of olivine components from a trapped inclusion may modify it considerably.
Here we see the range of Cl (and P2O5) both in very basic melt droplets in the spinel crystals of picrites and also in a range of ORB glasses.
|
 |
Another copy of the Macquarie diagram. The Romanche
Fracture zone in the Atlantic appears to include another series
of near primary parental melts and some minor fractionates. But
it differs from Macquarie in having lower Cs, Rb, Ba, Th, U, Nb,
K, La, Ce at a given MgO, as can be seen from the shapes of the
diagram shown in "ORBs of the Atlantic". The soda is slightly
higher and sodic island such as St Helena are close by. It is possible
that in the potassic South Atlantic near Tristan and Gough, a more
potassic series may be found, (the area of the "Dupal Anomaly")
Tine will tell. In the meantime, Macquarie appears to be by far
the most common type of parent series.,
Dima Kamenetsky of U. Tasmania is warmly thanked for allowing us
to use these (as yet) unpublished diagrams but shown at a poster
session. |
Comparison of Trends in Parental Melts, ORBs and some Alkaline Series
Range of Zr/Nb in MORB & OIB:
While OIBs are never as Nb depleted as ORBs, there is considerable overlap
between EMORB and OIB.
 |
Nb-Zr. Here the parental melt and fractionation trends diverge by over 70 deg.
Though alkaline OIBs are more enriched in both Nb and Zr compared with ORBs it is interesting that no OIB is as enriched in Nb relative to Zr as the EMORBs are. |
|
|
+ = La/Lu for Macquarie unfractionated
primary melt series.
x = Macquarie fractionated samples (from a range of parents).
* = EPR fractionated Series (Regelous, et al 1999).
o = Alcedo fractionated tholeiites, (Geist et al, 19??) |
K2O/Rb for Macquarie etc
 |
K and Rb show an average trend of only 247, though in detail this varies from 333 in the more depleted to 210 in the more enriched melts. The average trend passes closer to the origin than would be expected considering the wide range found in MORBs (>1000 - ~ 300). However, larger degree melts as found in the southern Reykjanes Ridge and in Kolbeinsey and part of the EPR are considerably more Rb depleted compared to even the most basic Macquarie rocks.
|
Comparison with Alkali basalt-Mugearites
The smaller degree Macquarie melts do in fact plot in the hawaiite-mugearite field and other possible even lower degree melts in the phonolitic tephrite fields on an alkali-silica diagram and are undeniably very alkaline. How do we tell them apart? The most K-rich apparent primary melts from Juan de Fuca also have an An27 normative feldspar. However, many features are different. Iron diminishes in the melt series as Ti increaces, so a comparison of the Macquarie melts with the Westmanneyjar mugearites and the St Helena series shows the EMORBs to have only half the iron. A Fe/Ti diagram shows the primary melts and the alkaline series trending at right angles Any LILE plotted against MgO rise much more steeply in the primary ORB magma series, especially K, Nb, Ba, Rb.
The Composition of Seamounts:
We might expect that the off-ridge seamounts would be of EMORB or even alkaline composition. However, as seen in Hawaii or Iceland any fissure eruption if long-lived, is likely to localise and form a shield or sea-mount.
PETDB classifies about 900 glasses as of seamount origin ( Feb, 2005). While EMORBs are prominent, the majority are ordinary NMORB and NONE appear to be of OIB type, Whether this is true for all ridge-associated seamounts or whether true alkaline series has been excluded we do not know, but the EMORBS are not shown as such but simply as "basalts".
 |
Variation diagram of 900 seamount analyses include many EMORBs of elevated K, P, Na and low FeO, in fact pretty much as general ridge samples. |
 |
MgO / K2O. Recall that the Macquarie primary melts lie along a line from 10% MgO at zero K to 5% K at zero MgO. Some of the fractionated EMORBS are extremely enriched in K (as well as Nb/Zr, La/Sm and light REE etc by a factor of about 30 compared with NMORB. There are some of the usual low K, high MgO samples present. Whether these are real or melts enriched in MgO by resorption of olivine we do not know. |
 |
La/Sm for seamounts. The NMORBs have La < 8 ppm and La/Sm of about 1. The ratio increases in the fractionated EMORBs to about 7.5. A few fractionated NMORBs are present (upper left) which retain the La/Sm of about 1. |
Recommendations Regarding Plotting
If plotting any element diagrams of MORB-EMORB rocks always include Kamenetsky's primary melt series data and at least one fractionated series such as that for the EPR (Regelous et al 1999). You will then be able to locate your samples in relation to all other oceanic crustal rocks. Both sets of data are now downloadable from the PETB data base.
Isotopic Implications
Kamenetsky's isotope data show clearly that Sr 87/86 ratio increases with decreasing degree of partial melt, while Nd ratios decline. Leads are also affected.
The implications of this for all isotopic work are far-reaching. (see Isotopes chapter)
 |
Sr87/86 isotopes increasing with Rb (= decreasing degree of melt).
One point is "wild" but the other six are quite conclusive.
Nd143/144 declines at the same time. For a discussion on Pb208/204 vs Pb206/204 see "Isotopes" |
Conclusions
We can conclude by saying that some 99% of the variance seen in ORB rocks is explicable and predicable, the remainder being mainly alteration of sample and analytical error. In some cases at least the boundaries shown could be made at least slightly more precise were more data from chilled glasses available especially for the trace elements. Highly fractionated EMORBs fractionates are known by their major elements but little trace XRF or ICPMS work has yet been done on them.
It does not appear at this point that there is any great need to postulate
variations in mantle composition or contamination in order to explain
the chemistry of the oceanic basaltic series but the existence of the
Romanche FZ near-primary magmas suggests that areas of more sodic nature
could occur. 2000 analysed chondrites show a wide spread in Na/K ratio..
Lead isotopes do show variations in Pb 206/208/204 but in some cases
at least, high Pb208 is found in samples of higher Th from which Pb208
is derived. It becomes a matter of whether a magma once generated can
be held long enough for the isotope levels to change. For what period
of time does a partial melt remain as an interstitial melt, before being
expelled upwards? Years certainly, thousands of years? Quite possibly.
HOME
Copyright © 1998-2006 Dr B.M.Gunn
|